

-


-
06:00 AMI wake up to the chilly morning air. My day starts early but full of energy. EVAEVA is an eco-friendly material with elasticity and softness which makes it ideal to be used as soles of sneakers. Its properties of transparency, flexibility and low-temperature sealability make it an ideal material for laminating films and solar-module sheets.
-
09:00 AMAs always, people hurry their steps onto the subway to go to work. CACaustic soda is used in wide range of industries, such as paper, textiles, detergents, metals, food, and electrical generation. In particular, Chlorine is used to produce polycarbonates.
-
02:00 PMA cup of coffee cheers me up in the middle of a hectic day. PEA polymer with outstanding physical properties and environmental stability, it is found in many different forms of plastic items we use every day. Polyethylene coating in paper cups prevent leakage.
-
06:00 PMTime to wrap up! The red taillights on congested roads tell me it’s time to go home. TDIsTDI is a feedstock for PU resin and adhesives. Flexible foams are used in shoes, furniture, automotive components, bedding, and toys, while semi-rigid foams are used in car interior materials.
-
11:00 PMTime to rest up for a fresh start tomorrow. Survived another day, good job! PVCPVC has a wide range of applications in the home, such as wallpapers, flooring materials, window frames, cable sheathing, stationary and toys.
Consolidated
Revenue Unit billion KRW
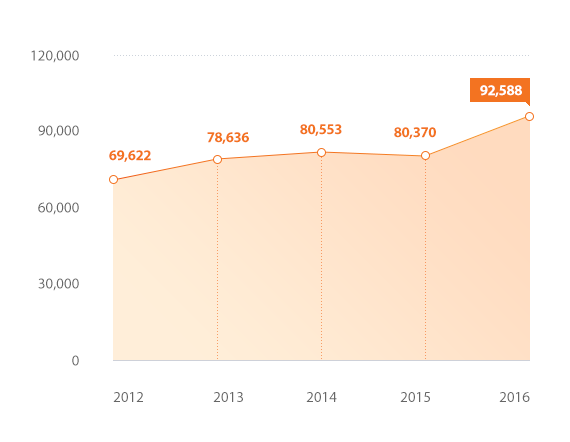
- 2012 : 69.622
- 2013 : 78,636
- 2014 : 80,553
- 2015 : 80,370
- 2016 : 92,588
Net Income Unit billion KRW
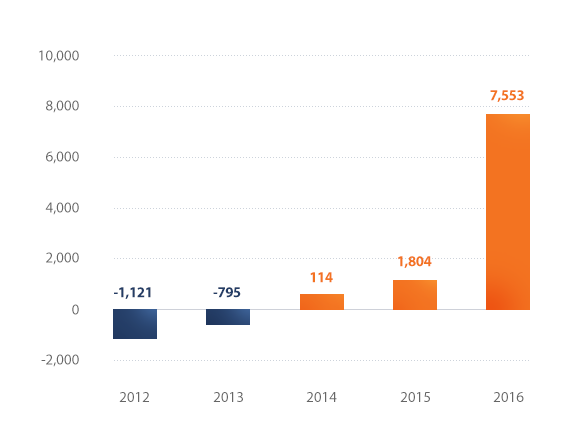
- 2012 : -1.121
- 2013 : -795
- 2014 : 114
- 2015 : 1,804
- 2016 : 7,553
Consolidated Income Statement
Unit billion KRW| 2012 | 2013 | 2014 | 2015 | 2016 | |
|---|---|---|---|---|---|
| Sales | 69,622 | 78,636 | 80,553 | 80,370 | 92,588 |
| Operating profit | 52 | 979 | 1,413 | 3,370 | 7,792 |
| Net Income | -1,121 | -795 | 114 | 1,804 | 7,709 |
| Profits attributable to owners of the parent |
296 | 83 | 567 | 1,882 | 7,553 |
Consolidated Balance Sheet
Unit billion KRW| 2012 | 2013 | 2014 | 2015 | 2016 | |
|---|---|---|---|---|---|
| Current assets | 35,826 | 44,697 | 42,728 | 47,777 | 45,239 |
| Non-current assets | 88,241 | 83,374 | 83,242 | 90,749 | 92,940 |
| Total assets | 124,067 | 128,071 | 125,970 | 138,526 | 138,179 |
| Current liabilities | 42,493 | 43,970 | 44,412 | 54,206 | 49,630 |
| Non-current liabilities | 35,919 | 39,533 | 33,763 | 35,008 | 33,866 |
| Total liabilities | 78,412 | 83,503 | 78,175 | 89,214 | 83,496 |
| Controlling interests | 40,957 | 40,573 | 43,741 | 46,334 | 52,849 |
| Non-controlling interests | 4,697 | 3,995 | 4,054 | 2,978 | 1,834 |
| Total equity | 45,654 | 44,568 | 47,795 | 49,312 | 54,683 |

